 Magpie Trader
Wednesday, August 31, 2005
Yesterday's trade, 4

1 Min - I mainly use the 5 min chart to trade, but I'm learning to use the 1 min too - it's been costly in the past as I've felt like a rabbit caught in the headlights before, unable to think and act as price is moving so quickly. Yesterday was much better though and it was more down to feeling relaxed and prepared than anything else.
After I'd arrived back about 9.15 UK BST:
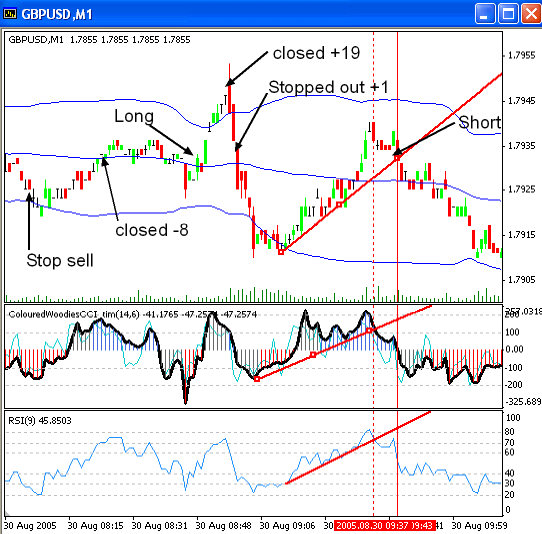
My stop sell at 7921 had been triggered (2 pips below previous bottom) due to my previous analysis of a major down trend, the order was put in as I'd been called away - almost fatal with a spike up to come. Lesson learnt. Anyway I arrived back at my screen to see price move away off the 5 min and 1 min bollinger bands.
My thinking was:-
we are in a major down trend but there's resistance at the M2 pivot, and on the black chart there's historical resistance. So closed the first order for -8 and waited for an entry long as there was a good probability we could head to the top of the 5 min bollinger band and possibly the central pivot at 7981.
As it was a counter trend trade I take 15 to 20 pips as soon as they're given to me and move my stop to BE +1 asap. I was lucky to get 19 pips on the run up as the order went in at around 15 pips. 90 seconds later my stop was taken out.
Now flat.
Next there was a break of the Asian session low - this is a very high probability trade and a major indication of direction for the next 2 to 4 hours of the european session. When the asian session low/high is broken ALWAYS wait for the retrace then enter. This typically takes between 30 minutes to an hour. Wait for a candlestick like a spinning top or inverted hammer to complete on the 15 min chart and enter 1 pip underneath/above it's close. I learnt this off Phil Newton at Trading-strategies. I've since started adapting this for the 1 minute chart entry as seen in the picture. I'm looking for CCI to turn over, usually around the 200 level, then a CCI TL break, RSI confirms usually a bar or so later (not in this case though). There was also a little 1-2-3 top with a bollinger band top line failure.
The price fall also took price through the M2 pivot - another confirmation.
On the way down price paused at the S1 pivot at 1.7877 for 45 mins before continuing on. It never fails to amaze me how price reacts to pivots.
So we've got:- an attempt north that has failed (more often than not towards the end of the Asian session price will head towards the new euro session central pivot (calculated at 5am UK BST) - not this time though), a break of a pivot south, there's now divergence on the 15 minute chart a 'Zero line reject' on the 30 min CCI combined with a CCI TL break. MACD is south of the water line and flat. The target low for the day is 7849, which also happens to be the 61% fib from the previous run up. And also the 561EMA on the Daily chart is at 7858. Added to the fact is it's also a big fat down trend. If the first entry was missed there was plenty others on the way down.
My stop sell entry at 1.7921 is causing me to think though as although it was correct I'd have had to sit through a large draw down and probably been stopped out as I tend to use a 30 pip stop. (This has happened quite a lot on entries like this in the past and it's looking more like a dodo). Perhaps if I'm called away an entry above price around the descending EMAs to take into account the spikes (shortening the SL too) is a better idea. Alternatively, being in front of the screen is always preferable.
// posted by Magpie @ 1:13 pm 
![]()