Tuesday, September 06, 2005
05/09/05 con't and 06/09/05
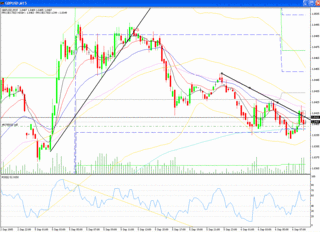
 Yesterday's second trade is on this chart too (red arrow under top TL), although it was against the trend the divergences on the hourly and 15 minute were too much for it. The trade I got stopped out on was simply getting in too early... Trying to pick a top is almost impossible (as I've proved many times), so waiting for a nice trend break was too much of a tempation. Got in at 18483 and took profits at the pivot on a limit as I was in bed at 18425
+ 58
Today's trade so far is another short at 18403, it's a down trend now until at least the 18320 area. That's what I'm thinking, but there's the London open and the middle bollinger band on the hourly to get through.
 Magpie Trader